
Lamb Seeing Increased Useage In Restaurant Industry
Julie Stepanek Shiflett, Ph.D., Juniper Economic Consulting
Lamb is the fastest growing animal protein on restaurant menus, and in 2014, appeared on 13 percent more menus than in 2000, according to a recent Dataessential report (Humann, M., 6/2015). The trend is boosted by the adoption of spicy merguez sausage – which typically features lamb as an ingredient – one of the fastest growing entrée proteins (Humann, M. 6/2015).
Lamb is also making in-roads in more casual dining. Among restaurant chains and independents, lamb grew 3 percent in 2014 and was up 44 percent during the past nine years. One-quarter of casual restaurants feature lamb on their menus. Now… if we could only get Arby’s to use lamb in its gyro.
 As Mary Humann – ALB foodservice consultant – explained, there is ample opportunity for expanded lamb demand in restaurants (6/2015). Chefs like lamb and consider it a premium meat. Second, interest in local food remains strong. In fact, the No. 1 hot restaurant trend for 2015 is locally-sourced meats and seafood (Humann, M. from NRA/ACF Survey, 10/2014). Furthermore, Mediterranean cuisine is expanding and lamb’s flavor profile is a natural fit in that area.
Recent data suggests that lamb demand at foodservice has grown. In the year ending March 19, lamb sales in U.S. restaurants grew 12 percent while volume sold was up 7 percent. During the same year, the average price of lamb climbed 4 percent to $7.09 per lb. More consumers are buying lamb at higher prices.
Feeder Lamb Market Lifted
Some harvesting of new crop lambs helped boost the June feeder lamb market. Sixty- to 90-lb. feeders at auction in Colorado, South Dakota and Texas averaged $201.32 per cwt. in June, 7 percent higher monthly and 3 percent higher year-on-year.
Feeder lamb prices in direct trade averaged $158.40 per cwt. in June, up 6 percent monthly and up 19 percent year-on-year. Over 5,500 head were traded out of California with weights ranging from 100 to 135 lbs. June’s feeder lamb price was 17 percent shy of June’s 2011 record of nearly $190 per cwt.
Ramadan Helps to Support Auction Prices
Lamb prices at auction saw a price lift in June likely due to the celebration of the Muslim holiday Ramadan, which began June 18 and ran for a month. During the month, Muslims fast, but celebrate with an evening social gathering around a lamb meal.
Slaughter lamb prices on formula were already committed to a packer by mid-June and weakened month-to-month given ample market-ready supplies.
Slaughter lamb prices at auction averaged $155.94 per cwt. in June, 1 percent higher monthly and 0.6 percent lower year-on-year. The San Angelo (Texas) auction saw relatively lower prices at $145.50 per cwt., while South Dakota was higher at $163.25 per cwt. and Kalona, Iowa, was higher still at $175.75 per cwt.
Slaughter lamb prices on a carcass-weight formula averaged $269.92 per cwt. ($144.25 per cwt. live-weight equivalent) in June, 1 percent lower monthly, yet up 4 percent year-on-year.
Live, negotiated slaughter lambs averaged $145.91 per cwt., up 7 percent monthly and 2 percent higher year-on-year.
Fall Clip pelts averaged $3.63 per piece in June, down 6 percent monthly and down 15 percent year-on-year. By June, packers were still charging feeders and producers to dispose of No. 3 and No. 4 clips.
During Ramadan, the New Holland Sales Stable auction in Lancaster, Penn., attracts many lambs with more than 2,600 head selling in a one-day sale in early June. Reportedly, the preferred lamb is weaned and weighs from about 60 to 90 lbs., however, lambs of all weights sell. This year, Ramadan prices were roughly 13 percent higher across all weight classes and quality compared to last year. Ninety to 110 lbs. lambs received $208 per cwt. while lighter weight 40-50 lb. lambs received $211 per cwt.
USDA Releases Direct Lamb Reports
This year is momentous: the first year of U.S. Department of Agriculture direct lamb reports. For the first time, there are publically-available reports capturing sales direct to the consumer. New reports consist of farmers market reports, grass fed and pasture raised lamb sold directly to consumers; in addition to wholesale grass fed lambs direct to restaurants.
The direct sales reports are a response to the growing number of farmers and ranchers that sell outside of the mainstream, commercial market and sell direct. These growing markets provide market opportunities for many producers and might also serve as competition to the commercial market by siphoning a growing volume of lambs away from the largest commercial packers.
While grass fed lamb might not be the most cost effective method to produce large volumes of commodity lamb, many would argue that the lamb industry is no longer a commodity market, but evolving into niche, specialty markets.
An important benefit of the direct lamb reports is that the lamb is of U.S. origin. It is the only publically-available report of retail lamb that is specified by origin. The USDA report of retail lamb in grocery feature ads is not identified by origin. In a recent Colorado State University/Ohio State University study, the food service sector reported that being local is the top-ranked non-negotiable trait in the decision to buy lamb by butchers and foodservice operators.
The grass fed price report complements the USDA Grass Fed Program for Small and Very Small Producers (producers with 99 ewes or less) which began last year. The program allows producers to market sheep as USDA Certified grass-fed, either as lambs or market ready lamb, “increasing their market value and creating new economic opportunities for these producers,” (USDA website, Accessed 7/10/15). The 99 ewes or less criteria captures about 30 percent of all ewe flock operations in the U.S. and accounts for about 32 percent of the total inventory of ewes and lambs.
In June, grass fed lamb prices direct to consumer were nearly double to more than 160 percent higher than the only other publically-available retail price we have, feature retail prices at supermarkets. For example, ground lamb was $6.60 per lb. featured at grocery stores and $12.85 per lb. for grass fed lamb sold direct to consumers.
In 2015, USDA also began publishing a pasture raised lamb report in North Carolina (allowing for possible minimal grain supplement). Prices reflect lambs that are sold directly from producers to consumers – direct from the farm and at farmer’s markets – on a retail basis. Not only is the North Carolina report pasture raised lamb, but local lamb. North Carolina saw a sharp 20 percent ewe inventory increase in 2014 compared to the 0.6 percent increase reported nationally.
USDA also began to report prices from farmer’s markets in 2015. While most markets do not report lamb, many do. In early July, USDA had farmer’s markets reports from 13 states with multiple market reports from many states. Prices from five farmer’s markets were reported from Maryland, alone; four for North Carolina and two for Iowa. At the Des Moines Farmer’s Market, lamb leg was $12 per lb., shoulder was $12 per lb., ground lamb was $10 per lb. and cubed lamb was $11 per lb. for week ending June 28.
USDA also publishes a separate local and organic lamb price report at supermarkets. The weighted average price for an organic butterflied, boneless leg for 35 stores was $9.99 per lb. during the week ending July 2. Eight stores reported a lamb loin chop for a weighted average of $11.99 per lb.
One drawback of the direct lamb reports is that volume is not collected. We don’t know the market share of grass fed lamb, for example. The grass fed beef market grew from about 3 percent in its early years to about 6 percent of the total beef market today so we might estimate that grass fed lamb accounts for about 3 percent of the commercial lamb market.
Forecasts
Demand for new crop lambs will rise rapidly as the old crop lambs are sent to harvest. If old crop lambs are “cleaned up” earlier rather than later this summer then this bodes well for third-quarter live lamb prices. According to the Livestock Market Information Center, feeder and slaughter lambs could soften seasonally between the second and third quarters, but remain higher year-on-year.
LMIC forecasted that total lamb and mutton supplies in the third quarter could contract by 10 percent quarterly which will help support prices. U.S. production could drop 2 percent quarterly, but the squeeze in supplies could come primarily from a 20 percent quarterly drop in imports.
In early July, LMIC forecasted that slaughter lamb prices on a carcass basis could range from $312-$319 per cwt. in the third quarter, 0.5 percent lower quarterly and 7 percent higher than a year ago. Slaughter lamb prices at auction are typically 2 percent lower in the third quarter than the annual average. Prices dip lower still, on average, in the fourth quarter, however, 4 percent lower than the annual average.
Feeder lamb prices in the three markets of Colorado, South Dakota and Texas for 60-90 lbs. lambs are expected to range from $206 to $217 per cwt., a 1 percent drop quarterly and 6 percent higher year-on-year. The feeder lamb market during the third quarter is typically the lowest-priced quarter of the year, at about 6 percent lower than the annual average.
USDA Purchase Program Supports Market
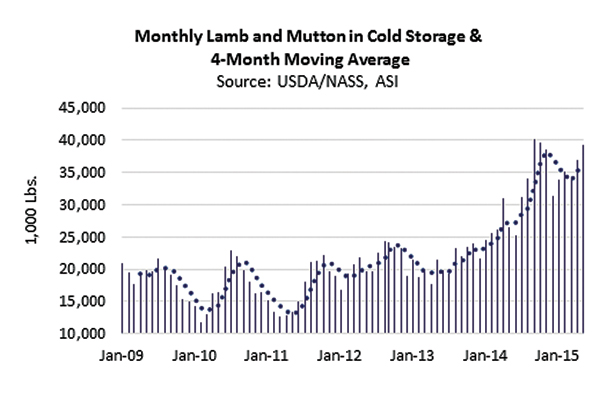
The USDA opened its invitation of 640,000 pounds of lamb leg roast, bone-in and boneless, on June 24 – the start of a $10 million commitment to help support lamb producers in a period of high imports, high freezer inventories and lower prices.
At the beginning of June, 39.2 million lbs. of lamb and mutton was in cold storage, up 6 percent monthly and 48 percent higher year-on-year. We don’t know what portion of this stock is domestic versus imported lamb. Imported lamb in 2014 was up 12 percent annually. Lamb imports from Australia, alone, were 20 percent higher in 2014 year-on-year. In the first six months of this year, lamb imports from Australia were up 9 percent year-on-year.
Higher imports, coupled with high freezer inventory, prompted a slowdown in harvest rates this year. In June, an estimated 7 percent fewer lambs were sent to harvest compared to a year ago. Lower harvest rates inevitably meant many lambs got heavier. Forty-three percent of lambs priced on a grid or formula were 85 lbs. carcass weight (170 lbs. live weight) and heavier in June.
In the commercial lamb market, yield grades (percent of saleable meat from the carcass) have drifted higher representing increased back fat deposits. In January through May, 39 percent of lambs going to harvest were yield grade 3 (often the most preferred yield grade) compared to 43 percent during the same time a year ago. Yield grades 4 and 5 (with more back fat) totaled 25 percent compared to 21 percent a year ago. This means that this year, one-quarter of commercial lambs were of less than desirable yield grades.
By June, some progress had been made in getting old crop lamb (lambs born during the spring of 2014) to market. The USDA Agricultural Marketing Service explained, “Feedlots are continuing to run through old crop lambs and the ideal goal is to have them all through the harvest facilities by the first of August. They are now replacing them with springer lambs as they are available,” (USDA/AMS, 6/26/15).
Wool Market Higher
In early July, the USDA AMS reported that most of the shearing is coming to close and the majority of the big wool runs were slowing down. The collection of smaller pools of wool will now commence in preparation for fall sales. Reportedly, U.S. wools yielded very well this year with yields at about 50 percent and some at 60 percent. Overall, U.S. wool was reported as generally clean with little poly or hair contamination.
From March through June, U.S. wools in the fleece states and territory states were priced about 8 percent lower year-on-year. By contrast, Australian wool was up an average 16 percent during this period. However, U.S. wools received generally higher prices than expected given the strong U.S. dollar which generally makes U.S. exports less competitive on international markets.
 In the fleece states (midwest and some Californian wools) June wool prices were about 10 percent stronger monthly and were about 4 percent lower for the mid-microns compared to a year ago, but about 5 percent higher for the coarser microns (25 and 26). Fleece state wool prices were as follows on a clean basis: 21 micron for $3.90 per lb., 22 micron was $3.93 per lb., 23 micron averaged $3.63 per lb., 24 micron averaged $3.39 per lb., 25 micron was $3.28 per lb. and 26 micron was $3.03 per lb.
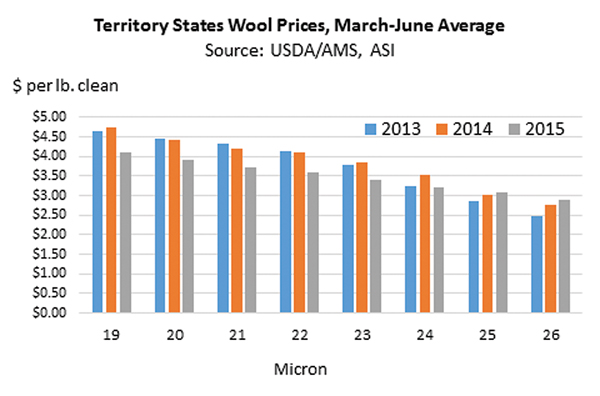
June wool prices in the territory states (western U.S. and some Californian wools) ranged from 1 to 8 percent higher monthly. Compared to a year ago, 22 to 25 micron wools were about 6 percent lower, but up to 17 percent higher for 26 micron.
In the territory states, 19 micron averaged $4.21 per lb. clean, 21 micron was $3.91 per lb., 22 micron was $4.02 per lb., 23 micron was $3.63 per lb., 24 micron was $3.45 per lb., 25 micron was $3.31 per lb. clean and $3.09 per lb. for 26 micron.
The Australian wool market rallied in early June, but by the end of the month the market saw an 8 percent weakening as Chinese pipelines filled and Australian supplies were more ample than first anticipated. By late June, the Australian Eastern Market Indicator was only 12 percent of its mid-2011 historical high. On average, Australian wool prices averaged 1,328 Australian cents per kg clean in June, 7 percent higher monthly and 29 percent higher year-on-year. In its Agricultural Commodities June quarter 2015 report, the AWEX EMI is forecast to increase 11 percent in 2015-2016 to average 1,230 Australian cents per kg clean.