Restaurant Sales Surpass Grocery Sales

By Julie Stepanek Shiflett, Ph.D.
Juniper Economic Consulting

Recent foodservice expansion can be an important source of growth for the lamb industry. In early June, the Daily Livestock Report noted that “foodservice sales business appears to be in great shape and this is nothing but good news for the livestock sector,” (6/1/15). The U.S. Census Bureau confirmed in May that for the first time ever, restaurant sales exceeded grocery sales (5/13/15). Improved weather, lower gas prices, higher income and overall increased economic confidence have all contributed to increased restaurant traffic.

Targeting high-value markets can be key to achieving higher margins for lamb operators. In general, grocery store prices are double manufactures’ prices and restaurant prices are more than 200 percent higher (U.S. Department of Agriculture, 12/1/14). The U.S. rack – featured mostly in restaurants – is nearly double the price of the Australian rack. The U.S. rack is larger than the comparable Australian cut, but the difference in price is significant, suggesting that the larger margins afforded restaurants may also allow them to pay more for lamb.
Recent lamb rack prices followed national trends, to some extent. In April, the foodservice sector saw an 11 percent growth in sales from a year ago. By comparison, grocery sales slumped 0.6 percent year-on-year (USDA, 5/2015). Domestic racks – featured mostly in restaurants – saw higher growth rates this spring than the imported rack – found mostly in grocery stores, but both were weaker than a year ago. The U.S. rack, roast-ready, frenched, cap-off averaged $1,902 per cwt. at wholesale this year, down 5 percent year-on-year. The imported Australian rack, cap-off, 28 oz. and up, was also down this year, down 3 percent to $988 per cwt.
Overall, restaurant sales are likely to continue climbing. Given that an estimated 65 percent of lamb’s value comes from the restaurant sector, higher foodservice demand can mean higher feeder and slaughter lamb prices in coming months. The National Restaurant Association found that when asked about their current restaurant usage, a significant proportion of the public say they would like to patronize restaurants more (5/13/15).
The growth in restaurant sales is dominated by the younger generation while older Americans are spending more at grocery stores (Bloomberg, 4/14/15). Younger Americans like fast food fast and “their diversity and interest in new things draw them to more ethnic restaurants, according to the National Research Association (Bloomberg, 4/14/15). Lamb lends itself perfectly to exotic flavors.

Retail Up

While restaurant sales have made headlines, lamb grocery sales have also made important monthly and year-on-year gains, although some cuts remained depressed.
The USDA Agricultural Marketing Service reported that the lamb feature activity index was up 50 percent weekly for Mother’s Day in early May, but was only moderate the week before Memorial Day (5/22/15). In preparation for Memorial Day – start of the grilling season – AMS reported: Chop items proved more popular than roast items, as chops made up 71 percent of the ad volume. In the lamb retail sector, loin chops continue to be a popular item. Price levels seen for Memorial Day were at steady to mostly lower values as retailers tried to attract business with offering cheaper prices (AMS, 5/22/15).
Some important lamb cuts saw higher values year-on-year, yet surprisingly the loin – important to summer grilling – was lower in May. The boneless, butterfly leg, averaged $7.52 per lb. in features in May, down 16 percent monthly, yet up 15 percent year-on-year. Another popular retail cut, shoulder blade chops averaged $5.47 per lb. in May, 2 percent higher monthly and up 9 percent year-on-year. Ground lamb saw an 11 percent gain monthly to $7.72 per lb., up 6 percent year-on-year.
In May, loin chop sales averaged $9.26 per lb., 13 percent higher monthly and 2 percent lower year-on-year.

Feeder Lambs Prices Mixed

Ninety to 110 lb. feeder lamb prices at auction – at Colorado, South Dakota and Texas –averaged $184.42 per cwt., down
6 percent monthly and 7 percent lower year-on-year. Feeder lamb prices in direct trade averaged $149.60 per cwt. in May, up 5 percent monthly and 5-percent lower than a year ago.
AMS reported that more than 4,000 head of new crop feeders were traded out of California in May with weights averaging about 120 lbs. Seven hundred head traded out of Texas with lighter weights, about 98 lbs. AMS explained that the feeder lamb “movement has been slow due to higher numbers of sheep still in the feedlots and lower numbers of animals being harvested on a weekly basis” (5/29/15).
It looks like more erratic and severe weather will be a continued challenge for lamb feeding. Although Texas has seen record floods, drought remains a concern in many western states with much of the west falling under the top three drought rankings from exceptional to severe according to the U.S. Drought Monitor (6/2/15).
However, the Imperial Valley remains a trusted feeding ground. The sheep industry can likely rely upon feed supplies in California’s Imperial Valley for some time to slow lambs’ maturing and provide consumers with lamb year-round. However, while it might be an insurmountable task to wrestle water away from the Valley, water rights challenges are more likely if California’s four-year drought continues. The Imperial Valley uses a disproportionate amount of Colorado River water relative to southern California’s populated cities.
State-wise, it was the wettest May in Texas, Oklahoma, and Colorado, and one of the top 5 wettest Mays in Utah, Kansas, Wyoming, Arkansas, and South Dakota (U.S. Drought Monitor, 6/9/15). According to the United States Drought Monitor map for June 9, less than 8 percent of Texas was still in some level of drought. The last time this occurred was June 2010. Since 2010, Texas’ breeding sheep inventory fell 15 percent to 435,000 head. In the last 10 years its breeding stock fell 35 percent.

Only time will tell if improved moisture will help Texas rebuild its sheep flock. Other constraints to expansion exist: predators and competing investments, such as hunting.

Slaughter Lambs Prices Up

Harvest rates continued to slow into May as demand was insufficiently strong to get lamb moving out of feedlots and out of freezers. AMS explained: “Consumer demand is still the largest struggle point at this time and packers are continuing to decrease bids,” (5/29/15).
On May 22, the U.S. Department of Agriculture announced plans to purchase lamb products for surplus removal. It is hoped that the program will help support the live and wholesale lamb markets.
At around 35,500 head, weekly lamb and sheep harvest was down 12 percent in May compared to a year ago. Live harvest weights were up 2 percent from a year ago, but not enough to offset sharply lower slaughter numbers, so weekly production was off 10 percent compared to a year ago. At 56.5 million lbs. estimated lamb production in the U.S. January through May was down 5 percent year-on-year.
Colorado feedlots remained high in numbers, explained AMS in May. It is expected that old crop lambs (born last spring) will get sent to market in June and July (maybe August). The Midwest was still current on inventory and has been relieving western feedlots by taking extra lambs out of Colorado into their harvest facilities (5/29/15).
Slaughter lamb prices at auction in Colorado, South Dakota and Texas from 130-180 lbs. averaged $142.09 per cwt. in May, 4 percent higher monthly and 1 percent higher year-on-year.
Slaughter lamb prices on a carcass-based formula averaged $288.96 per cwt. ($145 per cwt. live-equivalent) in May, up 0.12 percent and 3 percent higher than a year ago. Weights averaged 85.30 lbs., 3 percent higher monthly and 4 percent higher year-on-year.
Live, negotiated slaughter lambs averaged $136.19 per cwt., up 4 percent monthly and down 7 percent form a year ago. Weights averaged 161.30 lbs., up 3 percent monthly and 3 percent higher year-on-year.
Pelt Prices Steady to Lower
Pelt prices dropped even lower for some pelts in May, during a period when many didn’t think the market could get any lower. Heavy rains in Colorado feedlots likely reduced pelt quality with increased mud.
Fall clips averaged $3.85 per piece, 28 percent lower monthly and half its May 2014 value. No. 1 pelts averaged $1.60 per pelt, down by half monthly and down 77 percent year-on-year. In May, packers were asking feeders and producers for a disposal fee for the shorter pelts – No. 2s, 3s and 4s – up to $1.75 per piece.
Unshorn pelts, or never shorn, averaged $5.40 per piece, 21 percent weaker monthly and 44 percent lower year-on-year.
Higher recent wool prices, tighter lamb supplies and healthier economies could lend support to pelts in coming months. Adrian Knox, managing director of Melbourne exporter Knox International, commented that environmental problems in China are easing and in Russia – the other major leather-processing country – the economy is improving, (ABC Rural, 4/26/15). Mr. Knox added: “Despite current low returns, the outlook for the lambskin market in 2015 is healthier than the previous year,” (ABC Rural, 4/26/15).

Wholesale Market Weakened

The lamb wholesale market remained relatively flat to lower during the past year with all primals trended downward this late winter and spring. Given recent strength at foodservice and retail, the depressed wholesale market might be a harbinger of slowing retail and restaurant lamb sales to come. The lamb purchase program and import volumes through the summer will likely dictate – to some extent – whether the wholesale lamb market can rebound.
The gross carcass value (carcass equivalent wholesale value) averaged $357.57 per cwt. in May, 2 percent lower monthly and 3 percent weaker year-on-year. After accounting for processing and packaging, the net carcass value averaged $323.82 per cwt.
Mother’s Day likely helped boost leg prices, which strengthened in May, but not by enough to support the entire gross carcass value. The rack weakened in May, as did the shoulder and loin. The leg, trotter-off, saw an average $345.12 per cwt., up 5 percent monthly yet 8 percent weaker year-on-year.
The 8-rib rack, medium, averaged $751.23 per cwt., 3 percent lower in May and 7 percent weaker year-on-year. The shoulder, square-cut, averaged $286.57 per cwt. in May, down 2 percent for the month and down 3 percent from a year ago.
The loin, trimmed 4×4, averaged $519.92 per cwt. in May, down 0.4 percent monthly, but 7 percent higher year-on-year. The weaker loin was a surprise because historically the wholesale loin gains seasonally in May for Memorial Day. However, loin gains the past two years were not seen until June and July. Perhaps cooler temperatures and wet weather tampered recent Memorial Day grilling.
Ground lamb held at $565.22 per cwt. in May, down 0.40 percent monthly, yet 7 percent higher year-on-year.

Imports Slowed

At 42.6 million lbs., total lamb imports in the first quarter were down 8 percent from the fourth quarter of 2014, but up 10 percent year-on-year. Australian lamb was up 4 percent in this time year-to-year, New Zealand lamb was up 22 percent.
By March, imports had slowed. Australian lamb imports dropped 2 percent monthly to 13.7 million lbs., New Zealand lamb imports were down 12 percent to 6 million lbs. and total lamb imports were off 6 percent from a year ago at 20 million lbs.
As the Livestock Marketing Information Center explained: The Australian dollar has gone from trading near parity with the U.S. dollar to now trading at a significant discount. June futures currently peg the exchange at 0.76 U.S. cents per 1 AUD. Last year in late May, the exchange was around 0.94 US cents per 1 AUD (5/22/15).

Forecasts

LMIC forecasted in early June that both feeder and slaughter lamb prices could weaken by about $1-$3 per cwt. quarterly, but with prices establishing at levels higher than a year ago. Third-quarter slaughter lambs on a direct, carcass-basis could range from $312-$319 per cwt., 7 percent higher year-on-year. Sixty- to 90-lb. feeder lambs in a three-market average could range from $206-$217 per cwt., up 6 percent year-on-year.
LMIC explained that income growth could slow in mid- to late-2015, slowing retail sales growth. However, as LMIC noted, growth in foodservice/restaurant spending is expected to continue to outpace that of grocery stores. “That spending pattern indicates prices at wholesale levels of meat and poultry items sold by restaurants could benefit compared to items more tied to at home consumption” (LMIC, 5/22/15).

Harvest Weights Rise

Harvest weights have risen for Colorado feedlot lambs waiting to be marketed. In January, 6 percent of lambs going to slaughter were 95 lbs. and heavier, but that number climbed to 20 percent of lambs in May. That means one in five lambs are over 95 lbs. carcass weight, or over 190 lbs. live weight. This is about 40 lbs. heavier than historical market weights.
Fortunately, the heaviest lambs have had some price support. In May, the 95-lb. carcasses averaged $269.21 per cwt. (about $134 per cwt. live-weight). The last time lambs got similarly heavy was May through August 2013 when again about one-fifth of weekly harvest was over 95 lbs. carcass weight. However, at that time, prices averaged in the low $200s per cwt. or about 34 percent lower than current levels.
All-in-all, the heaviest lambs in May were priced about $28 per cwt. less than the more ideal 140-lb. lambs. This $28 per cwt. loss is a cost to the industry that isn’t likely recuperated in sales.
In the first-quarter of 2015, 23 percent of harvested lambs were yield grades 4s and 5s. The percent of yield grade 5s tripled from 3 percent in December to 9 percent by May.

Wool Prices at Four-Year High

AMS explained that raw wool demand was good in late May.
“Interest in selling wool has still been high. Another rally has really peaked interest at this time and has been conducive to an active market, making growers more willing to sell wool,” (5/29/15). Expectations of lower wool supplies worldwide – from grower through the supply pipeline – spurred a lot of the recent activity.
Eamon Timms, wool brokerage manager for Fox and Lillie, said demand was strong from Indian and Chinese buyers. Timms continued, “Some of the buyers had ‘buy at best’ orders, which basically means do not stop bidding until you get the wool,” (ABC Rural, 6/1/15). “The fashion houses are using more wool, there is stronger demand for knitted fabrics, and U.S. and European consumers are looking at woolen fabrics in a more favorable light,” explained Rabobank analyst Georgia Twomey (ABC Rural, 6/1/15).
At the end of May, AMS reported that wool trades saw western wools trade at rates mostly between 80 to 85 percent of Australia with some of the lower micron wools (finer wools) trading as high as 90 percent (5/29/15). Midwestern wools saw an increase as well, trading between 75 to 85 percent of Australia, with the majority at the 80 percent range.
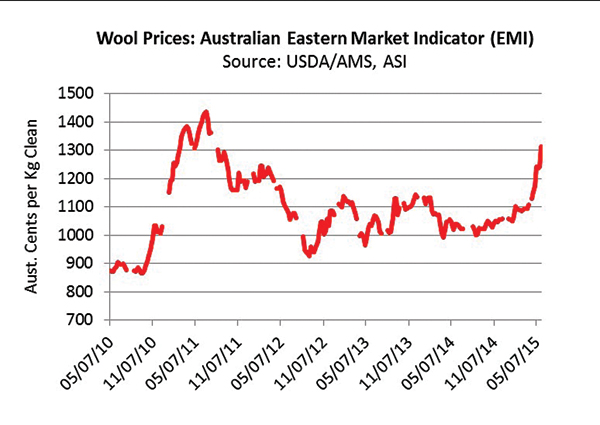
In early May, the Australian market rallied. During the five trading weeks of May, the Australian Eastern Market Indicator (EMI) jumped 11 percent from $1,172 to $1,312 Australian cents per kg clean. At the end of May, the EMI was 26 percent higher than a year ago and at a four-year high.
In early May, AMS explained that in the U.S. the rally had some wool growers holding tighter to their wool, to see how high it (prices) could go before deciding to sell. However, by the end of May the report tone changed. AMS explained, “Currency and optimism overseas have been the biggest contributors to the (domestic) rally,” 5/15/15.
In general, the U.S. dollar is very strong relative to the Australian dollar, but a little respite in early May, when the U.S. dollar rose from 76 cents per Australian dollar to 80 cents, helped boost the U.S. wool market.
This year’s yields were improved over last year, except for those drought-hit pockets across the west. Dirt penetration in the wools from a dry winter and spring can reduce wool yields. Yield is the amount of clean wool produced from raw (or grease) wool in the scouring process.
Mike Corn, Roswell Wool manager, commented that thus far he has seen less polypropylene and hair sheep contamination than in the past (6/8/15). However, there is still wool out there for rains slowed shearing across parts of Utah, Idaho and Wyoming.
In general, the coarser U.S. wools received higher prices than a year ago while the mid-micron to finer wools were down anywhere from 0.4 to 12 percent year-on-year.
In the Fleece States (Midwestern and some Californian wools) 22 micron averaged $3.54 per lb. in May, up 15 percent monthly and 10 percent lower year-on-year. Twenty-three micron averaged $3.31 per lb. clean, 24 micron averaged $3.10 per lb., and both were down about 10 percent year-on-year. Twenty-five micron brought $3.05 per lb. clean, up 11 percent monthly and up 0.5 percent from a year ago. Twenty-six micron averaged $2.73 per lb. clean, down
6 percent from a year ago.
In the Territory States (western and some California wools), the finer 19 micron brought $4.28 per lb. clean, 20 micron averaged $4.20 per lb., 21 micron averaged $3.86 per lb., 22 micron brought $3.70 per lb., 23 micron brought $3.48 per lb., 24 micron averaged $3.33 per lb., 25 micron averaged $3.19 per lb., 26 micron averaged $2.97 per lb. and 27 micron averaged $2.76 per lb. clean.
AMS explained that clean prices reported are FOB warehouse (grower delivers) in original bag or square pack, bellies out, some graded, and 76 mm or longer. Further, no allowance is made for coring, freight or handling fees at the warehouse level to reflect actual prices growers receive. Wools shorter than 75 mm typically are discounted 10 to 20 cents per lb. clean. Classed and skirted wools usually trade at a 10 to 20 per lb. clean premium to original bag prices.
Many wool market observers expect that the market will “remain at strength until global mill stocks are replenished” (woolnews.net from AWI, 5/29/15). As South African and South American seasons draw to an end, there will be increased pressure on Australia’s tight supply in coming weeks.
Skip to content